Large JavaScript bundles are a surefire way to lose user engagement and Not only are they slower to download but also more time-consuming to evaluate and execute by the browser.
To overcome this problem, we will discuss how to track the size of the bundles and make sure we don’t send too much JavaScript all at once and slow down our apps.
Here we will discuss the Angular CLI and a few simple commands to get a detailed report about the Angular application bundles so we can remove unwanted code and if any js or bundle uses more size then we can use an alternative module or js or apply our own code.
Angular CLI
open angular CLI and goto project directory
The first time, need to install the following npm module globally.
Need to install this module the first time only.
after successfully install this module build your angular code with --stats-json option like as bellow
OR
ng build --prod --build-optimizer --stats-json
OR
by using --stats-json option in your build one state file will generate it may be like as stats.json or stats-es2015.json or as per your angular/typescript version
after successfully build generated find states file like as stats.json or stats-es2015.json or any other.
Now for bundle analyze run the following command
OR
webpack-bundle-analyzer ./dist/stats-es2015.json
OR
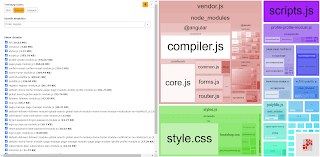
If followed correctly the Webpack bundle analyzer will open a report in your browser window that will look something like the following:
=>Some overview for this chart
Each color represents an individual bundle like vendor, main, styles, scripts, etc. We can further inspect each bundle and see the uncompressed and compressed sizes. This allows us to quickly determine what parts of our code are the largest and we can also decide whether we need to break our app up further or not and can reduce some parts.
Note: on any changes or removed modules or files. you can not see the effect directly. you have to re-generate the build and run webpack-bundle-analyzer command again to get the latest information.
I think it's clear how to optimize build size using Angular CLI and Webpack.
For more optimize your build you can also
->remove unwanted assets like images, js, css, etc
->minify js, css, images
->Don't use too many npm modules if not required and you can manage by your own way of javascript code
->always make common code that is used in many pages/modules.
More helpful links
->For implementing grunt tool in angular for boost page loading very fast
implement grunt tool in angular
-> webpack-bundle-analyzer npm link
https://www.npmjs.com/package/webpack-bundle-analyzer
From this link, you can more information about this module
->compress images
https://kraken.io/web-interface
For compress images, this site may be useful (after compress images and before replacing them in your real project first verify your all images)
I think this article may be very useful to you.


No comments:
Post a Comment